How to Activate Zendesk Explore for Reporting
How do I activate Zendesk Explore?
Activating Zendesk Explore is the first step to start using its powerful reporting and analytics features. When you first open Explore, it begins preparing your Zendesk data for reporting, which can take anywhere from a few minutes to a few hours depending on the volume of your data and tickets.
You can choose to be notified once Explore is ready for use. This activation process is crucial as it sets up your data for analysis, allowing you to create and customize reports tailored to your business needs. For more detailed instructions, you can refer to the originalZendesk help article.
More related questions
What are the user roles in Zendesk Explore?
Zendesk Explore offers different user roles to ensure secure access to your business information. These roles include Editors, Admins, and Viewers, each with varying levels of access. Editors can create custom reports and dashboards, while Admins…
How can I share reports in Zendesk Explore?
Sharing reports in Zendesk Explore is a great way to collaborate with your team. You can share reports on a one-time or recurring basis with anyone in your organization. Depending on your plan, you might also be able to share reports with…
What are dashboards in Zendesk Explore?
Dashboards in Zendesk Explore are spaces where you can present information about your Zendesk products. They are composed of widgets, which can include reports, images, text, and more. Zendesk provides prebuilt dashboards that display product…
What is a dataset in Zendesk Explore?
A dataset in Zendesk Explore is a collection of metrics and attributes that allow you to query information from different Zendesk products. Metrics are quantitative data, like the number of tickets, while attributes are qualitative data, such as…
How do I give users access to Zendesk Explore?
To give users access to Zendesk Explore, you need to configure their roles and permissions. This ensures that your business information remains secure while allowing your team to utilize Explore's capabilities. You can assign roles such as Editors,…
What are the next steps after learning the basics of Zendesk Explore?
Once you have a basic understanding of Zendesk Explore, the next step is to apply this knowledge practically. You can follow the hands-on tutorial provided by Zendesk, which guides you through creating a report, adding it to a dashboard, and…
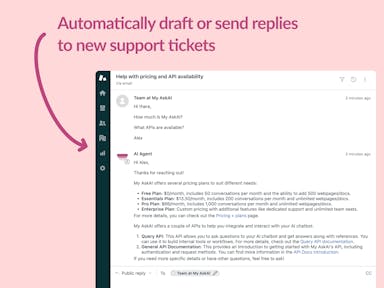
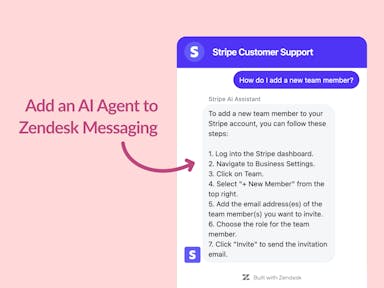
Interested indeflectingover 70% of your Zendesk support tickets?

Zendesk Support Tickets


Zendesk Messaging (live chat)

Join1,000+ companies reducing their support costs and freeing up support agents for more important work
“At the end of last year I was given the challenge - how can we provide the same or better service, without hiring anyone?”
Zinc
“We needed an AI agent integrated within our current tools. My AskAI was the only solution that wasn't going to disrupt our operations.”
Zeffy
“My AskAI blew everybody else out of the water. It made the selection process very easy for us.”
Customer.io($50M+ ARR)

“It now resolves 71% of queries (over 35,000 every month), meaning more time solving complex issues and improving UX.”
Freecash

“The difference was immediate. Customers get instant answers and our team can dedicate more time to solving complex problems"
Swytch Bike

“At the end of last year I was given the challenge - how can we provide the same or better service, without hiring anyone?”
Zinc

“We needed an AI agent integrated within our current tools. My AskAI was the only solution that wasn't going to disrupt our operations.”
Zeffy

“My AskAI blew everybody else out of the water. It made the selection process very easy for us.”
Customer.io($50M+ ARR)
“It now resolves 71% of queries (over 35,000 every month), meaning more time solving complex issues and improving UX.”
Freecash


Reduce support costs.Spend more time on customer success.

