Generate Performance Profile in Edge
How do I generate a performance profile in Edge for troubleshooting?
To generate a performance profile in Edge, open DevTools by pressing (COMMAND + OPTION + I) on macOS or (CTRL + SHIFT + I) on Windows or Linux, or by right-clicking on the page and selecting Inspect. Switch to the Performance tab and ensure the Screenshots checkbox is enabled.
Click the Record button and reproduce the issue. Try to keep the recording under 60 seconds. After reproducing the issue, click the Stop button and wait for the profile to load. Save the profile and send it to the customer service team. For more details, check theoriginal link.
More related questions
How do I generate a performance profile in Chrome for troubleshooting?
To generate a performance profile in Chrome, you need to use the DevTools. Open DevTools by pressing (COMMAND + OPTION + I) on macOS or (CTRL + SHIFT + I) on Windows or Linux, or by right-clicking on the page and selecting Inspect. Then, switch to…
What steps are needed to create a performance profile in Firefox?
Creating a performance profile in Firefox involves using the DevTools. Open DevTools by pressing (COMMAND + OPTION + I) on macOS or (CTRL + SHIFT + I) on Windows or Linux, or by right-clicking on the page and selecting Inspect. Navigate to the…
How can I generate a performance profile using Internet Explorer?
To generate a performance profile in Internet Explorer, open Developer Tools by pressing F12 or selecting F12 Developer Tools from the Tools menu. Switch to the Performance tab. Click the Record button and reproduce the issue. Although no timer is…
What is the process for creating a performance profile in Safari?
In Safari, you can create a performance profile by first enabling the Develop menu. Go to Safari > Preferences, click Advanced, and select Show Develop menu in menu bar. Then, click Develop > Show Web Inspector and switch to the Timelines tab….
Why is generating a performance profile important for troubleshooting?
Generating a performance profile is crucial for troubleshooting because it provides detailed data on how a webpage performs during user interactions. This data includes network URLs and screenshots, which can help identify the root cause of…
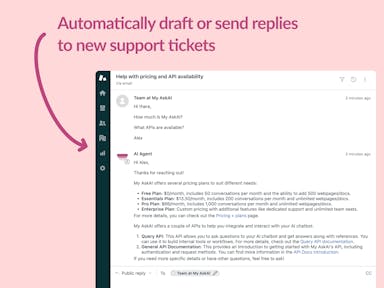
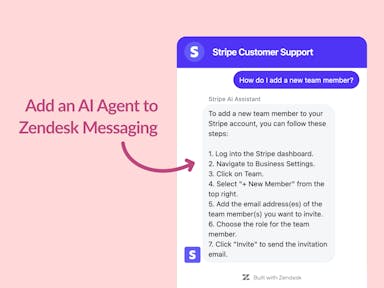
Interested indeflectingover 70% of your Zendesk support tickets?

Zendesk Support Tickets


Zendesk Messaging (live chat)

Join1,000+ companies reducing their support costs and freeing up support agents for more important work
“At the end of last year I was given the challenge - how can we provide the same or better service, without hiring anyone?”
Zinc
“We needed an AI agent integrated within our current tools. My AskAI was the only solution that wasn't going to disrupt our operations.”
Zeffy
“My AskAI blew everybody else out of the water. It made the selection process very easy for us.”
Customer.io($50M+ ARR)

“It now resolves 71% of queries (over 35,000 every month), meaning more time solving complex issues and improving UX.”
Freecash

“The difference was immediate. Customers get instant answers and our team can dedicate more time to solving complex problems"
Swytch Bike

“At the end of last year I was given the challenge - how can we provide the same or better service, without hiring anyone?”
Zinc

“We needed an AI agent integrated within our current tools. My AskAI was the only solution that wasn't going to disrupt our operations.”
Zeffy

“My AskAI blew everybody else out of the water. It made the selection process very easy for us.”
Customer.io($50M+ ARR)
“It now resolves 71% of queries (over 35,000 every month), meaning more time solving complex issues and improving UX.”
Freecash


Reduce support costs.Spend more time on customer success.

