Explore Reports on the Zendesk Support Dashboard
What reports are available on the Zendesk Support dashboard?
The Zendesk Support dashboard offers a variety of reports across eight different tabs, each focusing on different aspects of your support operations. These tabs include Tickets, Efficiency, Assignee Activity, Agent Updates, Unsolved Tickets, Backlog, Satisfaction, and SLAs.
Each tab provides specific insights, such as ticket creation, agent efficiency, customer satisfaction scores, and SLA compliance. You can filter these reports by various criteria like date, group, brand, and more to tailor the data to your needs.
More related questions
How do I open the Zendesk Support dashboard?
To access the Zendesk Support dashboard, simply navigate to Explore and click the Dashboard icon in the left sidebar. From there, you can select the Zendesk Support dashboard from the list of available dashboards. This dashboard provides a…
Can I customize the Zendesk Support dashboard?
Yes, you can customize the Zendesk Support dashboard by cloning it. This allows you to make modifications without affecting the default dashboard. Once cloned, you can edit the queries and filters to better suit your business needs, such as using…
How can I filter reports on the Zendesk Support dashboard?
The Zendesk Support dashboard allows you to filter reports by various criteria, including date, group, brand, channel, form, and more. Each tab on the dashboard offers different filtering options to help you focus on the data that matters most to…
What is the purpose of the Efficiency tab on the Zendesk Support dashboard?
The Efficiency tab on the Zendesk Support dashboard is designed to help you evaluate the efficiency of your agents. It provides reports that can be filtered by various criteria such as date, group, brand, and channel, allowing you to assess how…
How do I measure SLA compliance using the Zendesk Support dashboard?
The SLAs tab on the Zendesk Support dashboard helps you measure your results against the SLAs you have configured. You can filter these reports by date, SLA policy, SLA metric, and other criteria to get a detailed view of your compliance. This tab…
Can I use business hours instead of calendar hours in the Zendesk Support dashboard?
Yes, you can use business hours instead of calendar hours in the Zendesk Support dashboard by editing the default queries. However, these changes won't reflect on the default dashboard. To use business hours, you need to clone the prebuilt Support…
How can I save filtered states on the Zendesk Support dashboard?
You can save filtered states on the Zendesk Support dashboard using bookmarks. By adding a bookmark interactive widget, you can freeze the current state of filters. This allows viewers to switch between different bookmarks to see various filter…
Interested indeflectingover 70% of your Zendesk support tickets?

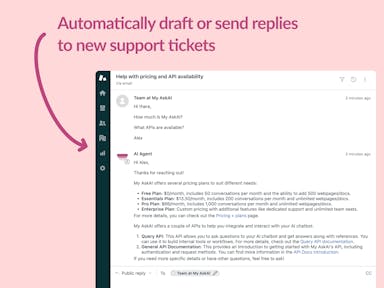
Zendesk Support Tickets


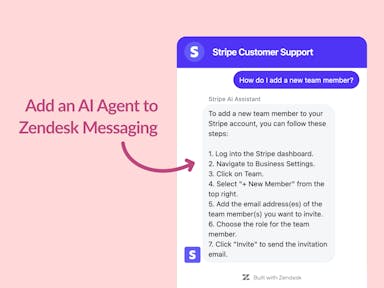
Zendesk Messaging (live chat)

Join1,000+ companies reducing their support costs and freeing up support agents for more important work
“At the end of last year I was given the challenge - how can we provide the same or better service, without hiring anyone?”
Zinc
“We needed an AI agent integrated within our current tools. My AskAI was the only solution that wasn't going to disrupt our operations.”
Zeffy
“My AskAI blew everybody else out of the water. It made the selection process very easy for us.”
Customer.io($50M+ ARR)

“It now resolves 71% of queries (over 35,000 every month), meaning more time solving complex issues and improving UX.”
Freecash

“The difference was immediate. Customers get instant answers and our team can dedicate more time to solving complex problems"
Swytch Bike

“At the end of last year I was given the challenge - how can we provide the same or better service, without hiring anyone?”
Zinc

“We needed an AI agent integrated within our current tools. My AskAI was the only solution that wasn't going to disrupt our operations.”
Zeffy

“My AskAI blew everybody else out of the water. It made the selection process very easy for us.”
Customer.io($50M+ ARR)
“It now resolves 71% of queries (over 35,000 every month), meaning more time solving complex issues and improving UX.”
Freecash


Reduce support costs.Spend more time on customer success.

