Capturing Errors in Zendesk Apps Framework
How can I capture errors in the Zendesk Apps framework?
To capture errors in the Zendesk Apps framework, use your browser's developer tools. This is the first step in troubleshooting unexpected app behaviors.
Each browser has its own way to access these tools: Chrome uses DevTools, Firefox has the Web Console, Safari includes developer tools in the Develop menu, and Microsoft Edge offers Edge DevTools. Once accessed, the console will display any errors or warning messages. For network request errors, check the network tab of the tool. This information is crucial for further research and debugging.
More related questions
How do I generate a list of installed apps in Zendesk?
Generating a list of installed apps in Zendesk is essential for identifying and troubleshooting app issues. You can use the API endpoint List App Installations to create a JSON list of all installed apps. This list includes properties like whether…
How can I identify the problematic app in Zendesk?
Identifying the problematic app in Zendesk involves selectively deactivating apps to find the one causing issues. You can deactivate an app by following the instructions in the Zendesk article on managing installed apps. Alternatively, append the…
What is a HAR file and how do I generate one for Zendesk?
A HAR file is a standard format for tracking information and events between a browser and a website, useful for troubleshooting performance or rendering issues. To generate a HAR file, you need to record the network events in your browser. This…
How can I use the Zendesk Apps API for troubleshooting?
The Zendesk Apps API can be a powerful tool for troubleshooting by generating a list of installed apps and using their properties for debugging. You can leverage the List App Installations API endpoint to get a JSON response containing app details….
Interested indeflectingover 70% of your Zendesk support tickets?

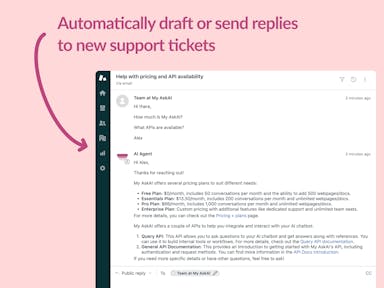
Zendesk Support Tickets


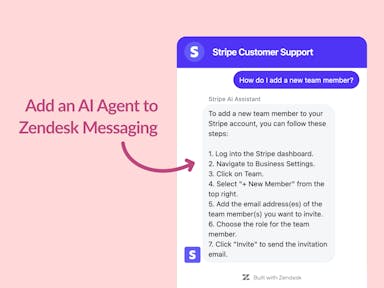
Zendesk Messaging (live chat)

Join1,000+ companies reducing their support costs and freeing up support agents for more important work
“We needed an AI agent integrated within our current tools. My AskAI was the only solution that wasn't going to disrupt our operations.”
Zeffy
“At the end of last year I was given the challenge - how can we provide the same or better service, without hiring anyone?”
Zinc
“My AskAI blew everybody else out of the water. It made the selection process very easy for us.”
Customer.io($50M+ ARR)

“It now resolves 71% of queries (over 35,000 every month), meaning more time solving complex issues and improving UX.”
Freecash

“We needed an AI agent integrated within our current tools. My AskAI was the only solution that wasn't going to disrupt our operations.”
Zeffy

“At the end of last year I was given the challenge - how can we provide the same or better service, without hiring anyone?”
Zinc

“My AskAI blew everybody else out of the water. It made the selection process very easy for us.”
Customer.io($50M+ ARR)
“It now resolves 71% of queries (over 35,000 every month), meaning more time solving complex issues and improving UX.”
Freecash


Reduce support costs.Spend more time on customer success.

