Adding Metrics to Zendesk Explore Reports
What are metrics and how do I add them to a report?
Metrics are quantifiable values like the number of tickets or wait times, essential for building reports.
To add a metric, go to the Metrics panel in your report, click Add, and select the desired metric from the list. You can expand or collapse folders to find specific metrics. Once selected, click Apply to see the results in your report. Explore automatically chooses the best aggregator for your metric, but you can change it if needed. For more details, see the section on adding metrics in the help docs.
More related questions
How can I create a report in Zendesk Explore?
Creating a report in Zendesk Explore is a straightforward process. You can start from the Reports library, a dataset, or a dashboard. To create a report from the Reports library, click the reports icon and then the New report button. Choose the…
How do I add attributes to my Zendesk report?
Attributes help slice your data by non-quantifiable values, such as ticket IDs or assignee names. To add an attribute, click Add in the Columns, Rows, Explosions, or Filters panel of your report. Select the attribute from the list and click Apply….
How do I save a report in Zendesk Explore?
Saving your report in Zendesk Explore is crucial to avoid losing your work. Once you've finished building your report, give it a descriptive name. Click Save in the top-right corner of the report builder. If you want to save a new copy without…
Can I create a report from a dashboard in Zendesk Explore?
Yes, you can create a report directly from a dashboard in Zendesk Explore. To do this, make sure your dashboard is in edit mode. In the dashboard customization menu, click Add and select Add report from the dropdown list. On the Add report page,…
What should I do if I can't create custom reports in Zendesk Explore?
If you're unable to create custom reports, it might be due to your Explore plan. Explore Lite does not support custom report creation. To access this functionality, you need to be on Explore Professional. If you're on a trial version, consider…
How can I view the results of a report in Zendesk Explore?
Once you've created and saved a report, you can view the results in several ways. You can revisit the report via the Reports library or add it to a custom dashboard. Dashboards can contain multiple reports, providing a comprehensive overview of…
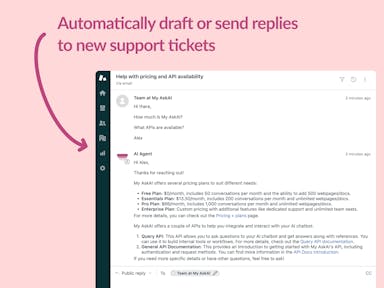
Interested indeflectingover 70% of your Zendesk support tickets?

Zendesk Support Tickets


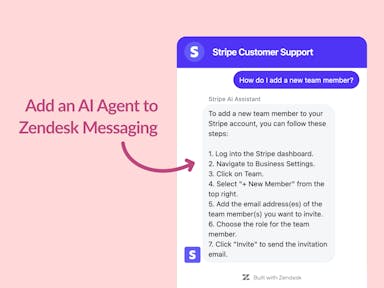
Zendesk Messaging (live chat)

Join1,000+ companies reducing their support costs and freeing up support agents for more important work
“At the end of last year I was given the challenge - how can we provide the same or better service, without hiring anyone?”
Zinc
“We needed an AI agent integrated within our current tools. My AskAI was the only solution that wasn't going to disrupt our operations.”
Zeffy
“My AskAI blew everybody else out of the water. It made the selection process very easy for us.”
Customer.io($50M+ ARR)

“It now resolves 71% of queries (over 35,000 every month), meaning more time solving complex issues and improving UX.”
Freecash

“The difference was immediate. Customers get instant answers and our team can dedicate more time to solving complex problems"
Swytch Bike

“At the end of last year I was given the challenge - how can we provide the same or better service, without hiring anyone?”
Zinc

“We needed an AI agent integrated within our current tools. My AskAI was the only solution that wasn't going to disrupt our operations.”
Zeffy

“My AskAI blew everybody else out of the water. It made the selection process very easy for us.”
Customer.io($50M+ ARR)
“It now resolves 71% of queries (over 35,000 every month), meaning more time solving complex issues and improving UX.”
Freecash


Reduce support costs.Spend more time on customer success.

