Adding Components to Zendesk Explore Dashboards
What components can I add to a Zendesk Explore dashboard?
In the Zendesk Explore beta dashboard builder, you can add reports and filters as the main components.
Reports provide metrics about your Zendesk usage, either current or historical, while filters allow you to slice this data based on specific characteristics. You can customize these components by adjusting their header, size, layout, and more. Each dashboard tab can hold up to 35 components. If you have legacy tabs with more than 35 components, you'll need to delete or move some before adding new ones.
More related questions
How do I create a dashboard using the Zendesk Explore beta dashboard builder?
Creating a dashboard in the Zendesk Explore beta dashboard builder is simple and intuitive. To get started, click the Dashboard icon in the left sidebar and then click 'Try it now' in the banner at the top. In the 'Start a dashboard' window, you…
How can I customize the layout of my Zendesk Explore dashboard?
Customizing the layout of your Zendesk Explore dashboard allows you to tailor it to your needs. By default, the dashboard layout automatically adjusts to fit the viewer's screen, with components snapping to the closest grid line. If this doesn't…
How do I add and manage tabs in a Zendesk Explore dashboard?
Adding and managing tabs in a Zendesk Explore dashboard helps organize information effectively. To add a tab, click the plus icon in the Tabs panel and choose to build from scratch or use a template. You can create up to ten tabs per dashboard….
How can I share my Zendesk Explore dashboard with others?
Sharing your Zendesk Explore dashboard allows others to view the insights you've created. To share, open your dashboard and click 'Publish changes', then 'Share'. In the Invite people window, search for and select the agents or groups you want to…
What is the drill-in feature in Zendesk Explore dashboards?
The drill-in feature in Zendesk Explore dashboards allows viewers to refine report results by slicing metrics with additional attributes. By default, drill-in is turned off to prevent unauthorized access to detailed data. If your dashboard has no…
How do I exclude reports from filters in a Zendesk Explore dashboard?
Excluding reports from filters in a Zendesk Explore dashboard ensures certain data remains unaffected by dashboard-level filters. This is useful for benchmark reports or when attributes don't apply to linked filters across datasets. To exclude a…
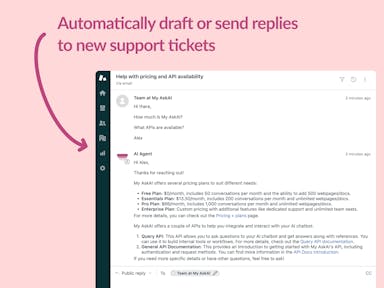
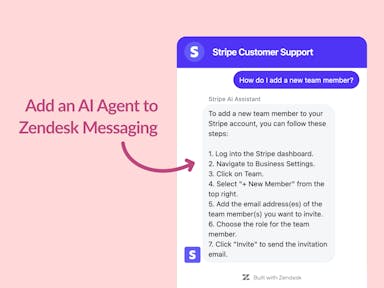
Interested indeflectingover 70% of your Zendesk support tickets?

Zendesk Support Tickets


Zendesk Messaging (live chat)

Join1,000+ companies reducing their support costs and freeing up support agents for more important work
“At the end of last year I was given the challenge - how can we provide the same or better service, without hiring anyone?”
Zinc
“We needed an AI agent integrated within our current tools. My AskAI was the only solution that wasn't going to disrupt our operations.”
Zeffy
“My AskAI blew everybody else out of the water. It made the selection process very easy for us.”
Customer.io($50M+ ARR)

“It now resolves 71% of queries (over 35,000 every month), meaning more time solving complex issues and improving UX.”
Freecash

“The difference was immediate. Customers get instant answers and our team can dedicate more time to solving complex problems"
Swytch Bike

“At the end of last year I was given the challenge - how can we provide the same or better service, without hiring anyone?”
Zinc

“We needed an AI agent integrated within our current tools. My AskAI was the only solution that wasn't going to disrupt our operations.”
Zeffy

“My AskAI blew everybody else out of the water. It made the selection process very easy for us.”
Customer.io($50M+ ARR)
“It now resolves 71% of queries (over 35,000 every month), meaning more time solving complex issues and improving UX.”
Freecash


Reduce support costs.Spend more time on customer success.

