Accessing Omnichannel Routing Queues Dashboard
How can I access the Omnichannel routing queues live monitoring dashboard?
You can easily access the Omnichannel routing queues live monitoring dashboard through the Dashboards library in Explore.
To do this, simply click the Dashboard icon in the left sidebar of Explore. From there, select the 'Omnichannel routing queues - live monitoring' option from the list of dashboards. This will allow you to view the prebuilt dashboard, provided you have omnichannel routing turned on and have created custom routing queues. For more details, check out theoriginal link.
More related questions
What information does the Omnichannel routing queues live monitoring dashboard provide?
The Omnichannel routing queues live monitoring dashboard provides detailed insights into your custom routing queues. This prebuilt dashboard displays a report that you can filter by Queues - Queue name and Queues - Group. It includes a 'Queues -…
Can I customize the Omnichannel routing queues live monitoring dashboard?
Unfortunately, customization options for the Omnichannel routing queues live monitoring dashboard are limited. If you're on a Professional plan, the dashboard is read-only, meaning you cannot share, clone, export, schedule, or drill into it….
Who can access the Omnichannel routing queues live monitoring dashboard?
Access to the Omnichannel routing queues live monitoring dashboard is contingent on your plan and settings. To use this dashboard, you must have omnichannel routing turned on and have created custom omnichannel routing queues. However, if you're on…
What are the limitations of the Professional plan regarding the live performance dashboard?
The Professional plan has several limitations when it comes to the live performance dashboard. Users on this plan can only view the prebuilt live performance dashboard in a read-only mode. This means you cannot share, clone, export, schedule, or…
Interested indeflectingover 70% of your Zendesk support tickets?

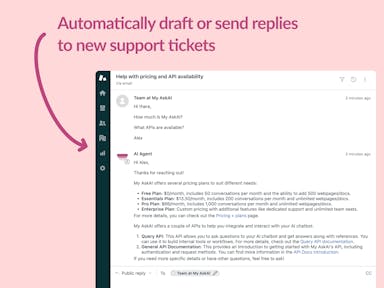
Zendesk Support Tickets


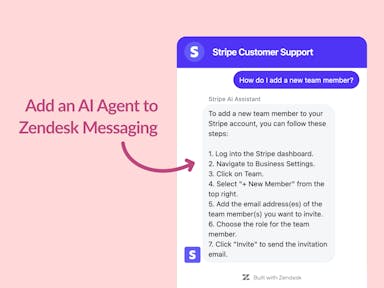
Zendesk Messaging (live chat)

Join1,000+ companies reducing their support costs and freeing up support agents for more important work
“We needed an AI agent integrated within our current tools. My AskAI was the only solution that wasn't going to disrupt our operations.”
Zeffy
“At the end of last year I was given the challenge - how can we provide the same or better service, without hiring anyone?”
Zinc
“My AskAI blew everybody else out of the water. It made the selection process very easy for us.”
Customer.io($50M+ ARR)

“It now resolves 71% of queries (over 35,000 every month), meaning more time solving complex issues and improving UX.”
Freecash

“We needed an AI agent integrated within our current tools. My AskAI was the only solution that wasn't going to disrupt our operations.”
Zeffy

“At the end of last year I was given the challenge - how can we provide the same or better service, without hiring anyone?”
Zinc

“My AskAI blew everybody else out of the water. It made the selection process very easy for us.”
Customer.io($50M+ ARR)
“It now resolves 71% of queries (over 35,000 every month), meaning more time solving complex issues and improving UX.”
Freecash


Reduce support costs.Spend more time on customer success.

