Key Data Points in Zendesk Sales Forecast
What are the key data points in the Zendesk sales forecast report?
The key data points in the Zendesk sales forecast report include Goal, Pending Forecast, Revenue, and Total Forecasted Value.
The Goal represents the sales target set for your team. Pending Forecast is calculated using the Estimated Close Date, Win Likelihood percentage, and Deal Value. Revenue is the total value of all won deals within the specified timeframe. Total Forecasted Value combines your current Revenue and Pending Forecast, providing a comprehensive view of your progress towards sales goals.
More related questions
How do I add the Forecast widget to my Zendesk Performance Dashboard?
To add the Forecast widget to your Zendesk Performance Dashboard, simply navigate to the Dashboard page and select the My Dashboard tab. If the Forecast widget isn't visible, you can add it by clicking on +Widget and selecting the Forecast widget….
What information does the Forecast widget display on Zendesk?
The Forecast widget on Zendesk provides a summary of your sales forecast, including key data points like Win Likelihood and Estimated Close Date. By clicking on the widget, you can access a detailed forecast report that shows your deals, both won…
How can I customize the view of my sales forecast report in Zendesk?
Customizing your sales forecast report in Zendesk is easy. You can adjust the timeframe to options like This Month, Last Month, or Yesterday, and group the data by criteria such as deal owner or team. Additionally, you can apply filters like Owner…
How do I save a customized view of my forecast data in Zendesk?
Saving a customized view of your forecast data in Zendesk is straightforward. After adjusting the timeframe and applying any necessary filters to your forecast report, simply click the Save button. This action will preserve your customized…
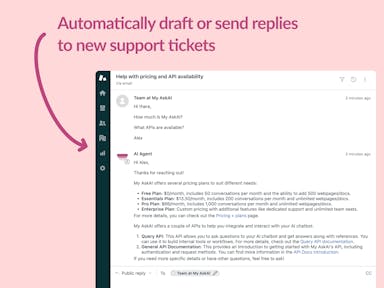
Interested indeflectingover 70% of your Zendesk support tickets?

Zendesk Support Tickets
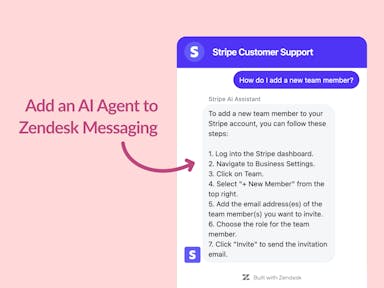
Zendesk Messaging (live chat)
Join1,000+ companies reducing their support costs and freeing up support agents for more important work
“We needed an AI agent integrated within our current tools. My AskAI was the only solution that wasn't going to disrupt our operations.”
Zeffy

“At the end of last year I was given the challenge - how can we provide the same or better service, without hiring anyone?”
Zinc
“My AskAI blew everybody else out of the water. It made the selection process very easy for us.”
Customer.io($50M+ ARR)

“It now resolves 71% of queries (over 35,000 every month), meaning more time solving complex issues and improving UX.”
Freecash

“We needed an AI agent integrated within our current tools. My AskAI was the only solution that wasn't going to disrupt our operations.”
Zeffy

“At the end of last year I was given the challenge - how can we provide the same or better service, without hiring anyone?”
Zinc

“My AskAI blew everybody else out of the water. It made the selection process very easy for us.”
Customer.io($50M+ ARR)
“It now resolves 71% of queries (over 35,000 every month), meaning more time solving complex issues and improving UX.”
Freecash


Reduce support costs.Spend more time on customer success.