Accessing Zendesk Reporting Overview: A Quick Guide
How do I access the Zendesk Reporting Overview?
To access the Zendesk Reporting Overview, simply click the Reporting icon in the sidebar. The Reporting Overview will open by default, allowing you to select a reporting period at the top. You can choose from predefined periods or set a custom date range up to three months. This custom range includes all dates from the start to the end date you select. Once you've set your period, you can analyze the data that appears in the Overview tab. For more detailed instructions, check out the originalZendesk help article.
More related questions
What data can I find in the Zendesk Reporting Overview?
The Zendesk Reporting Overview provides insights into ticket volume and management, allowing you to compare key ticket metrics. It includes data on new tickets, solved tickets, backlog, agent touches, satisfaction ratings, and first reply time….
How can I compare key ticket metrics in Zendesk?
To compare key ticket metrics in Zendesk, click the Reporting icon in the sidebar and select your desired reporting period. You can view individual ticket stats like new tickets, solved tickets, backlog, agent touches, satisfaction rating, and…
What are the additional ticket metrics available in Zendesk Reporting Overview?
In the Zendesk Reporting Overview, you can view additional ticket metrics such as Tickets by Channel, Benchmark, and First Reply Time. Tickets by Channel shows the percentage of tickets from each supported channel. Benchmark compares your key…
How can I view top content, searches, and agents in Zendesk?
To view top content, searches, and agents in Zendesk, access the Reporting Overview and select your reporting period. The bottom section contains panels for Help Center content, top searches, and top agents. You can filter content by views, votes,…
Why is the Zendesk Reporting Overview not updated in real time?
The Zendesk Reporting Overview is not updated in real time to ensure data accuracy and consistency. Most data is updated hourly, while satisfaction data is updated daily. This schedule allows for the aggregation and processing of data to provide…
What should I do if the Benchmark report in Zendesk doesn't display data?
If your Benchmark report in Zendesk doesn't display data, you may need to complete a brief survey to opt-in. Navigate to Admin Center > Account > Tools > Benchmark survey to complete it. After completing the survey, it might take some time for your…
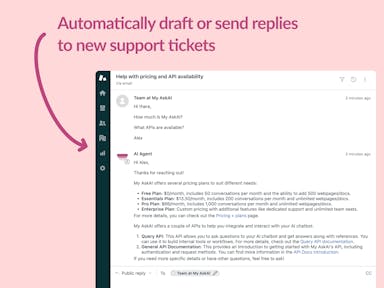
Interested indeflectingover 70% of your Zendesk support tickets?

Zendesk Support Tickets


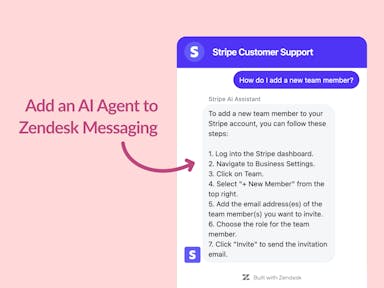
Zendesk Messaging (live chat)

Join1,000+ companies reducing their support costs and freeing up support agents for more important work
“We needed an AI agent integrated within our current tools. My AskAI was the only solution that wasn't going to disrupt our operations.”
Zeffy
“At the end of last year I was given the challenge - how can we provide the same or better service, without hiring anyone?”
Zinc
“My AskAI blew everybody else out of the water. It made the selection process very easy for us.”
Customer.io($50M+ ARR)

“It now resolves 71% of queries (over 35,000 every month), meaning more time solving complex issues and improving UX.”
Freecash

“We needed an AI agent integrated within our current tools. My AskAI was the only solution that wasn't going to disrupt our operations.”
Zeffy

“At the end of last year I was given the challenge - how can we provide the same or better service, without hiring anyone?”
Zinc

“My AskAI blew everybody else out of the water. It made the selection process very easy for us.”
Customer.io($50M+ ARR)
“It now resolves 71% of queries (over 35,000 every month), meaning more time solving complex issues and improving UX.”
Freecash


Reduce support costs.Spend more time on customer success.

