Views in the Loss Reasons by Owner Report
What are the different views available in the Loss Reasons by Owner report?
The Loss Reasons by Owner report offers both a graph view and a table view, each providing unique insights into your sales data. These views help you understand the performance of your sales team in different ways.
In the graph view, team members with closed deals are listed, and their performance in various loss categories is visualized. Hovering over each loss reason bubble reveals the number and percentage of deals lost. The table view presents the same data in a structured format, making it easy to compare and analyze. Both views are designed to help you make informed decisions based on your sales data.
More related questions
How can I use the Loss Reasons by Owner report in Zendesk Sell?
The Loss Reasons by Owner report in Zendesk Sell helps you analyze lost deals by team member. You can see how many deals each team member has lost and the reasons for those losses. This report is useful for understanding individual performance and…
What insights can I gain from the Loss Reasons by Owner report?
The Loss Reasons by Owner report provides insights into the performance of your sales team by showing how many deals each member has lost and the reasons behind those losses. This can help you identify patterns and areas for improvement. The report…
How do I filter data in the Loss Reasons by Owner report?
Filtering data in the Loss Reasons by Owner report allows you to focus on specific team members or time periods. This customization helps you analyze the data that matters most to your sales strategy. You can define a different time period to view…
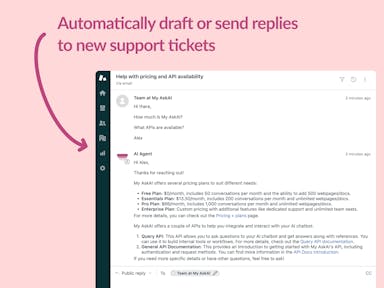
Interested indeflectingover 70% of your Zendesk support tickets?

Zendesk Support Tickets
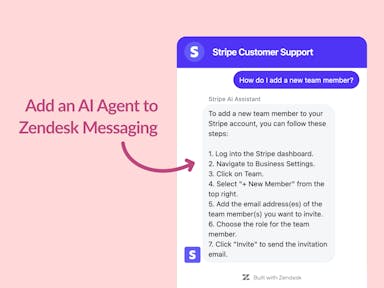
Zendesk Messaging (live chat)
Join1,000+ companies reducing their support costs and freeing up support agents for more important work
“We needed an AI agent integrated within our current tools. My AskAI was the only solution that wasn't going to disrupt our operations.”
Zeffy

“At the end of last year I was given the challenge - how can we provide the same or better service, without hiring anyone?”
Zinc
“My AskAI blew everybody else out of the water. It made the selection process very easy for us.”
Customer.io($50M+ ARR)

“It now resolves 71% of queries (over 35,000 every month), meaning more time solving complex issues and improving UX.”
Freecash

“We needed an AI agent integrated within our current tools. My AskAI was the only solution that wasn't going to disrupt our operations.”
Zeffy

“At the end of last year I was given the challenge - how can we provide the same or better service, without hiring anyone?”
Zinc

“My AskAI blew everybody else out of the water. It made the selection process very easy for us.”
Customer.io($50M+ ARR)
“It now resolves 71% of queries (over 35,000 every month), meaning more time solving complex issues and improving UX.”
Freecash


Reduce support costs.Spend more time on customer success.